EGYPT’S NORTH COASTIndependent guide · City · Coast · HomesOCTOBER 2026

RAS EL HEKMA / REGIONAL SEA SEASONS

The sea,
month by month.

Explore 35 years of sea-surface estimates around the cape. See the seasonal pattern, compare years and keep the original grid visible.

January 1991–December 2025 · NOAA OISST v2.1 · guide review 14 October 2026

0.25° grid

Each cell covers a broad area. This is regional context, not the temperature at a particular beach, pool or lagoon.

March · 17.2 °C

Lowest same-month mean at the default reference cell across the reviewed 35 years.

August · 27.2 °C

Highest same-month mean at that cell. A monthly average does not describe every day.

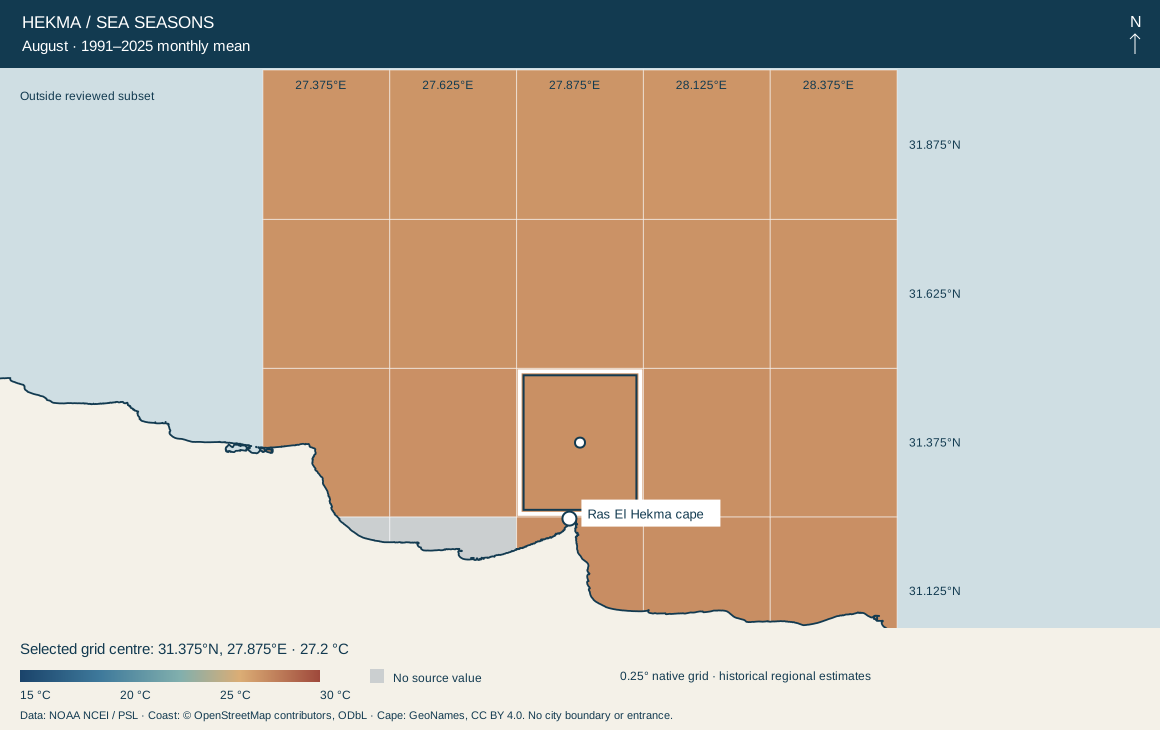
Ras El Hekma regional sea temperatureNOAA OISST v2.1 monthly estimates on native quarter-degree cells. Source coast shape is separate. Land is not temperature data. Grey cells have no source value. Not a beach or lagoon thermometer or forecast.31.125°N, 27.375°E: No source value31.125°N, 27.625°E: No source value31.125°N, 27.875°E: 27.3 °C31.125°N, 28.125°E: 27.2 °C31.125°N, 28.375°E: 27.2 °C31.375°N, 27.375°E: 27.1 °C31.375°N, 27.625°E: 27.1 °C31.375°N, 27.875°E: 27.2 °C31.375°N, 28.125°E: 27.1 °C31.375°N, 28.375°E: 27.1 °C31.625°N, 27.375°E: 27.0 °C31.625°N, 27.625°E: 27.0 °C31.625°N, 27.875°E: 27.0 °C31.625°N, 28.125°E: 27.0 °C31.625°N, 28.375°E: 27.0 °C31.875°N, 27.375°E: 27.0 °C31.875°N, 27.625°E: 27.0 °C31.875°N, 27.875°E: 27.0 °C31.875°N, 28.125°E: 26.9 °C31.875°N, 28.375°E: 26.9 °C27.375°E27.625°E27.875°E28.125°E28.375°E31.125°N31.375°N31.625°N31.875°NOutside reviewed subsetRas El Hekma capeHEKMA / SEA SEASONSAugust · 1991–2025 monthly meanNSelected grid centre: 31.375°N, 27.875°E · 27.2 °C15 °C20 °C25 °C30 °CNo source value0.25° native grid · historical regional estimatesData: NOAA NCEI / PSL · Coast: © OpenStreetMap contributors, ODbL · Cape: GeoNames, CC BY 4.0. No city boundary or entrance.

August · 1991–2025 monthly mean. The outlined cell is a regional analysis area.

The default centre is at 31.375°N, 27.875°E, about 14.4 km north of the cape reference. The native grid is roughly 24 km east–west by 28 km north–south here. The coast outline is separate geographic data; temperatures are not smoothed to the beach. Grey cells have no source value.

READ THE SEASONAL PATTERN

One month is a range
of different years.

Blue shows the 1991–2025 same-month mean at the selected cell. The band runs from the lowest to highest monthly mean across those years. Copper shows the selected period or the chosen year. The band is not a daily range or a forecast interval.

Sea temperature by calendar monthThe band is lowest to highest monthly mean across 1991–2025. It is not a daily range or forecast interval. Selected curve uses the chosen year or period.14 °C18 °C22 °C26 °C30 °C32 °CJanFebMarAprMayJunJulAugSepOctNovDecBlue: 1991–2025 mean · Band: range of yearly monthly means · Copper: 1991–2025
1991–2025 at 31.375°N, 27.875°E
MonthMeanLowest monthly meanHighest monthly meanYears
January18.4 °C17.3 °C19.8 °C35
February17.3 °C16.5 °C18.7 °C35
March17.2 °C16.0 °C18.3 °C35
April18.0 °C16.9 °C19.3 °C35
May20.3 °C18.5 °C21.6 °C35
June23.5 °C21.9 °C25.1 °C35
July25.9 °C24.5 °C27.5 °C35
August27.2 °C25.8 °C28.9 °C35
September26.8 °C25.5 °C28.1 °C35
October25.4 °C24.3 °C26.7 °C35
November23.0 °C21.8 °C24.7 °C35
December20.3 °C18.7 °C21.6 °C35

THE COMPLETE MONTHLY HISTORY

35 years.
420 monthly values.

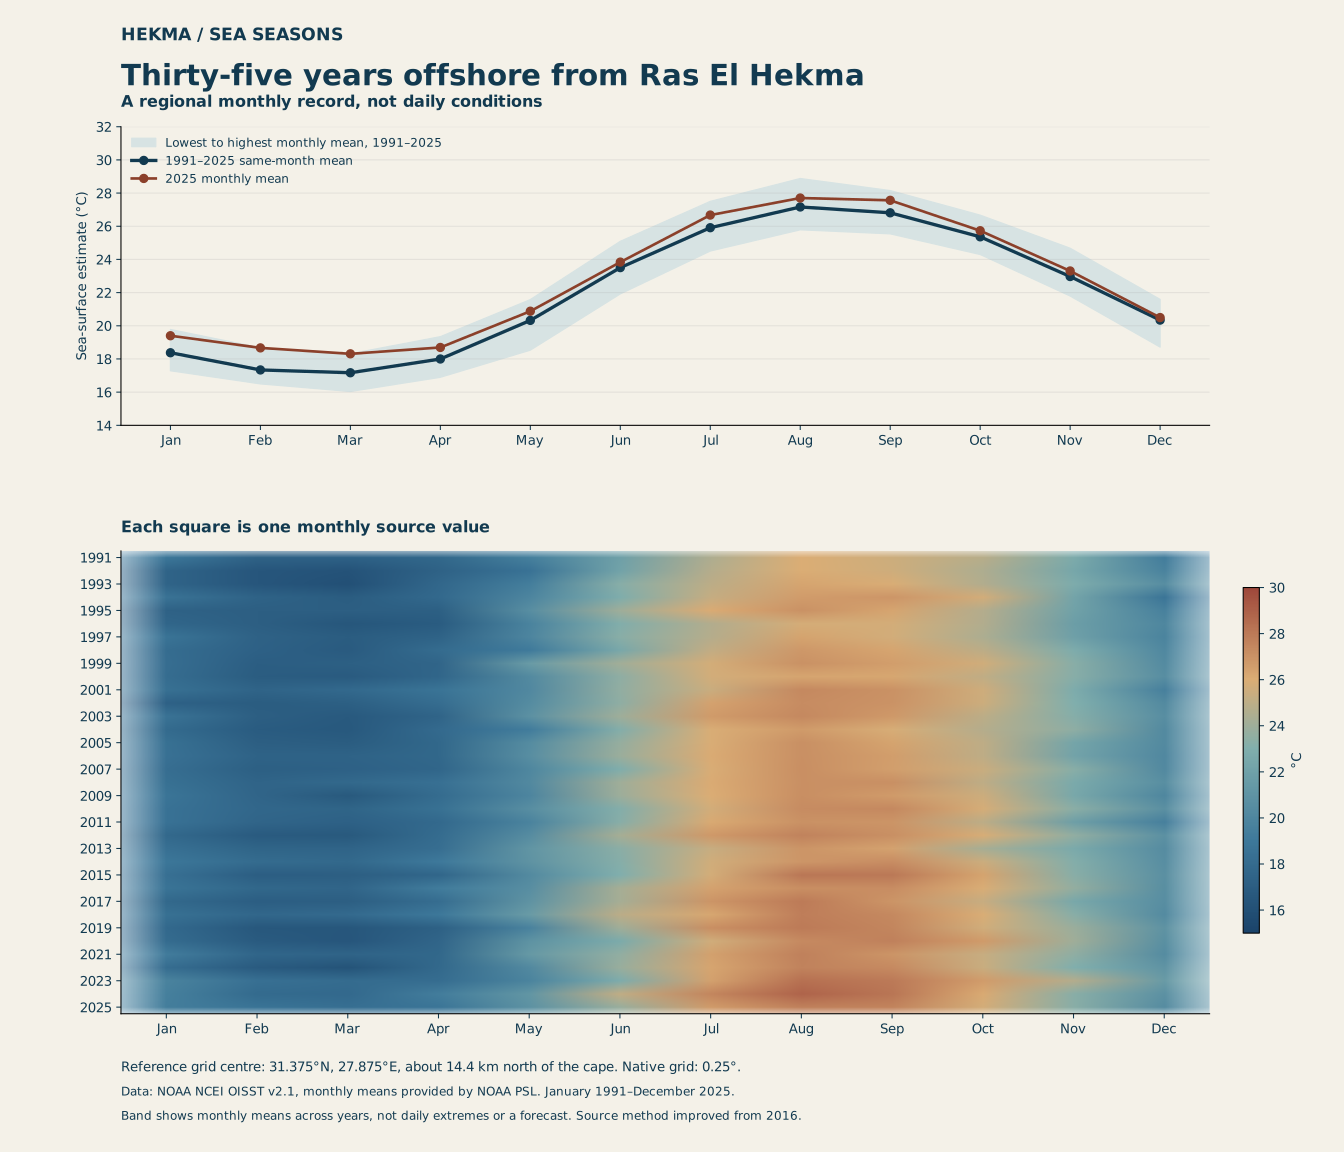
Each square keeps its own month and year. The same colour scale is used on the map and history. Source-method improvements from 2016 are part of this record; comparing periods does not by itself establish the cause of a difference.

1991–2025 monthly sea-temperature history420 monthly source values at the selected regional grid centre. Grey means no value. No smoothing into daily or beach temperatures.Each square is one month’s regional estimate.JanFebMarAprMayJunJulAugSepOctNovDec1991-01: 18.9 °C1991-02: 17.4 °C1991-03: 17.3 °C1991-04: 17.8 °C1991-05: 19.5 °C1991-06: 21.9 °C1991-07: 24.5 °C1991-08: 26.0 °C1991-09: 25.5 °C1991-10: 24.8 °C1991-11: 22.8 °C1991-12: 19.4 °C1992-01: 17.5 °C1992-02: 16.5 °C1992-03: 16.2 °C1992-04: 17.4 °C1992-05: 18.5 °C1992-06: 22.1 °C1992-07: 24.7 °C1992-08: 26.0 °C1992-09: 25.6 °C1992-10: 24.5 °C1992-11: 22.4 °C1992-12: 19.8 °C1993-01: 17.5 °C1993-02: 16.5 °C1993-03: 16.0 °C1993-04: 17.7 °C1993-05: 19.4 °C1993-06: 23.2 °C1993-07: 25.0 °C1993-08: 26.3 °C1993-09: 25.9 °C1993-10: 24.6 °C1993-11: 22.8 °C1993-12: 20.6 °C1994-01: 18.6 °C1994-02: 17.4 °C1994-03: 16.9 °C1994-04: 17.9 °C1994-05: 20.0 °C1994-06: 22.9 °C1994-07: 25.3 °C1994-08: 26.6 °C1994-09: 26.9 °C1994-10: 25.7 °C1994-11: 22.2 °C1994-12: 18.7 °C1995-01: 17.4 °C1995-02: 17.1 °C1995-03: 17.2 °C1995-04: 17.2 °C1995-05: 20.6 °C1995-06: 24.0 °C1995-07: 26.0 °C1995-08: 27.0 °C1995-09: 26.3 °C1995-10: 24.7 °C1995-11: 22.0 °C1995-12: 19.6 °C1996-01: 17.7 °C1996-02: 17.2 °C1996-03: 16.6 °C1996-04: 16.9 °C1996-05: 19.7 °C1996-06: 23.1 °C1996-07: 24.6 °C1996-08: 25.8 °C1996-09: 25.7 °C1996-10: 24.6 °C1996-11: 21.8 °C1996-12: 20.1 °C1997-01: 18.6 °C1997-02: 17.4 °C1997-03: 17.0 °C1997-04: 17.4 °C1997-05: 19.9 °C1997-06: 23.3 °C1997-07: 24.8 °C1997-08: 26.4 °C1997-09: 25.7 °C1997-10: 24.5 °C1997-11: 21.9 °C1997-12: 19.8 °C1998-01: 18.2 °C1998-02: 17.3 °C1998-03: 16.8 °C1998-04: 18.1 °C1998-05: 19.1 °C1998-06: 22.5 °C1998-07: 25.1 °C1998-08: 26.8 °C1998-09: 26.3 °C1998-10: 25.0 °C1998-11: 22.8 °C1998-12: 20.1 °C1999-01: 18.3 °C1999-02: 17.1 °C1999-03: 17.2 °C1999-04: 17.6 °C1999-05: 21.6 °C1999-06: 24.1 °C1999-07: 25.8 °C1999-08: 27.0 °C1999-09: 26.6 °C1999-10: 25.6 °C1999-11: 23.3 °C1999-12: 20.3 °C2000-01: 18.1 °C2000-02: 17.0 °C2000-03: 16.9 °C2000-04: 17.7 °C2000-05: 20.3 °C2000-06: 23.5 °C2000-07: 25.7 °C2000-08: 26.3 °C2000-09: 26.2 °C2000-10: 25.1 °C2000-11: 23.2 °C2000-12: 20.6 °C2001-01: 18.4 °C2001-02: 17.5 °C2001-03: 17.9 °C2001-04: 18.7 °C2001-05: 20.2 °C2001-06: 23.6 °C2001-07: 25.4 °C2001-08: 27.4 °C2001-09: 27.1 °C2001-10: 25.6 °C2001-11: 22.8 °C2001-12: 19.6 °C2002-01: 17.3 °C2002-02: 16.9 °C2002-03: 17.2 °C2002-04: 18.1 °C2002-05: 20.4 °C2002-06: 23.5 °C2002-07: 26.4 °C2002-08: 27.3 °C2002-09: 27.0 °C2002-10: 25.5 °C2002-11: 23.0 °C2002-12: 20.3 °C2003-01: 18.6 °C2003-02: 17.1 °C2003-03: 16.8 °C2003-04: 17.5 °C2003-05: 20.8 °C2003-06: 24.0 °C2003-07: 26.7 °C2003-08: 27.4 °C2003-09: 26.7 °C2003-10: 25.0 °C2003-11: 23.2 °C2003-12: 20.6 °C2004-01: 18.0 °C2004-02: 16.9 °C2004-03: 16.7 °C2004-04: 18.0 °C2004-05: 19.3 °C2004-06: 23.1 °C2004-07: 25.9 °C2004-08: 26.7 °C2004-09: 25.9 °C2004-10: 24.8 °C2004-11: 23.5 °C2004-12: 20.3 °C2005-01: 18.4 °C2005-02: 17.2 °C2005-03: 17.0 °C2005-04: 17.8 °C2005-05: 20.4 °C2005-06: 23.7 °C2005-07: 25.9 °C2005-08: 27.1 °C2005-09: 26.3 °C2005-10: 25.1 °C2005-11: 22.3 °C2005-12: 20.3 °C2006-01: 18.5 °C2006-02: 17.4 °C2006-03: 17.4 °C2006-04: 17.8 °C2006-05: 20.6 °C2006-06: 23.9 °C2006-07: 26.1 °C2006-08: 27.1 °C2006-09: 26.6 °C2006-10: 25.1 °C2006-11: 22.2 °C2006-12: 20.2 °C2007-01: 18.3 °C2007-02: 17.2 °C2007-03: 17.3 °C2007-04: 17.7 °C2007-05: 20.1 °C2007-06: 22.9 °C2007-07: 25.9 °C2007-08: 27.2 °C2007-09: 26.5 °C2007-10: 25.4 °C2007-11: 23.3 °C2007-12: 20.2 °C2008-01: 18.4 °C2008-02: 17.5 °C2008-03: 17.8 °C2008-04: 18.4 °C2008-05: 20.2 °C2008-06: 24.0 °C2008-07: 26.0 °C2008-08: 27.1 °C2008-09: 27.1 °C2008-10: 25.0 °C2008-11: 22.6 °C2008-12: 20.6 °C2009-01: 18.7 °C2009-02: 17.6 °C2009-03: 16.7 °C2009-04: 18.1 °C2009-05: 19.9 °C2009-06: 23.9 °C2009-07: 26.0 °C2009-08: 27.1 °C2009-09: 26.7 °C2009-10: 25.5 °C2009-11: 22.5 °C2009-12: 20.1 °C2010-01: 18.6 °C2010-02: 17.7 °C2010-03: 17.6 °C2010-04: 18.4 °C2010-05: 20.6 °C2010-06: 23.1 °C2010-07: 25.7 °C2010-08: 27.3 °C2010-09: 27.4 °C2010-10: 25.8 °C2010-11: 23.4 °C2010-12: 20.8 °C2011-01: 18.6 °C2011-02: 17.6 °C2011-03: 17.3 °C2011-04: 17.9 °C2011-05: 19.8 °C2011-06: 23.3 °C2011-07: 26.1 °C2011-08: 27.0 °C2011-09: 26.9 °C2011-10: 25.0 °C2011-11: 21.9 °C2011-12: 19.6 °C2012-01: 17.8 °C2012-02: 16.9 °C2012-03: 16.8 °C2012-04: 18.1 °C2012-05: 20.5 °C2012-06: 24.3 °C2012-07: 26.8 °C2012-08: 27.7 °C2012-09: 27.1 °C2012-10: 25.9 °C2012-11: 23.6 °C2012-12: 20.8 °C2013-01: 18.4 °C2013-02: 17.5 °C2013-03: 17.5 °C2013-04: 18.2 °C2013-05: 21.1 °C2013-06: 23.4 °C2013-07: 25.4 °C2013-08: 26.9 °C2013-09: 26.4 °C2013-10: 24.3 °C2013-11: 22.6 °C2013-12: 20.5 °C2014-01: 18.9 °C2014-02: 18.1 °C2014-03: 17.8 °C2014-04: 19.0 °C2014-05: 21.0 °C2014-06: 23.2 °C2014-07: 25.6 °C2014-08: 26.9 °C2014-09: 27.2 °C2014-10: 25.5 °C2014-11: 23.1 °C2014-12: 20.6 °C2015-01: 18.4 °C2015-02: 17.1 °C2015-03: 17.2 °C2015-04: 17.7 °C2015-05: 20.3 °C2015-06: 23.0 °C2015-07: 25.8 °C2015-08: 28.1 °C2015-09: 28.0 °C2015-10: 26.3 °C2015-11: 23.3 °C2015-12: 20.8 °C2016-01: 18.7 °C2016-02: 17.8 °C2016-03: 17.6 °C2016-04: 19.3 °C2016-05: 20.6 °C2016-06: 24.2 °C2016-07: 26.4 °C2016-08: 27.2 °C2016-09: 27.2 °C2016-10: 26.0 °C2016-11: 23.7 °C2016-12: 20.7 °C2017-01: 17.9 °C2017-02: 17.1 °C2017-03: 17.1 °C2017-04: 18.2 °C2017-05: 21.0 °C2017-06: 24.2 °C2017-07: 26.9 °C2017-08: 27.9 °C2017-09: 26.9 °C2017-10: 25.3 °C2017-11: 22.5 °C2017-12: 20.6 °C2018-01: 18.4 °C2018-02: 17.7 °C2018-03: 18.0 °C2018-04: 19.0 °C2018-05: 21.6 °C2018-06: 24.9 °C2018-07: 26.2 °C2018-08: 27.8 °C2018-09: 27.4 °C2018-10: 25.9 °C2018-11: 23.3 °C2018-12: 20.4 °C2019-01: 17.9 °C2019-02: 16.6 °C2019-03: 16.6 °C2019-04: 17.2 °C2019-05: 19.7 °C2019-06: 24.1 °C2019-07: 27.2 °C2019-08: 27.9 °C2019-09: 27.5 °C2019-10: 25.7 °C2019-11: 23.9 °C2019-12: 21.0 °C2020-01: 18.1 °C2020-02: 16.9 °C2020-03: 16.5 °C2020-04: 17.6 °C2020-05: 20.9 °C2020-06: 22.7 °C2020-07: 25.7 °C2020-08: 27.3 °C2020-09: 27.7 °C2020-10: 26.7 °C2020-11: 24.1 °C2020-12: 20.7 °C2021-01: 19.3 °C2021-02: 17.7 °C2021-03: 17.5 °C2021-04: 17.8 °C2021-05: 21.4 °C2021-06: 23.6 °C2021-07: 26.5 °C2021-08: 27.7 °C2021-09: 26.9 °C2021-10: 25.3 °C2021-11: 23.5 °C2021-12: 20.4 °C2022-01: 18.1 °C2022-02: 16.8 °C2022-03: 16.3 °C2022-04: 17.8 °C2022-05: 20.3 °C2022-06: 23.8 °C2022-07: 26.3 °C2022-08: 27.6 °C2022-09: 27.4 °C2022-10: 25.4 °C2022-11: 23.0 °C2022-12: 21.1 °C2023-01: 19.8 °C2023-02: 18.4 °C2023-03: 18.1 °C2023-04: 18.1 °C2023-05: 19.8 °C2023-06: 22.8 °C2023-07: 26.5 °C2023-08: 28.4 °C2023-09: 28.0 °C2023-10: 26.6 °C2023-11: 24.7 °C2023-12: 21.6 °C2024-01: 19.5 °C2024-02: 18.0 °C2024-03: 17.9 °C2024-04: 19.3 °C2024-05: 21.2 °C2024-06: 25.1 °C2024-07: 27.5 °C2024-08: 28.9 °C2024-09: 28.1 °C2024-10: 26.1 °C2024-11: 23.3 °C2024-12: 20.8 °C2025-01: 19.4 °C2025-02: 18.7 °C2025-03: 18.3 °C2025-04: 18.7 °C2025-05: 20.9 °C2025-06: 23.8 °C2025-07: 26.7 °C2025-08: 27.7 °C2025-09: 27.6 °C2025-10: 25.7 °C2025-11: 23.3 °C2025-12: 20.5 °C19911992199319941995199619971998199920002001200220032004200520062007200820092010201120122013201420152016201720182019202020212022202320242025Quarter-degree regional grid · no current conditions or daily extremes.NOAA OISST v2.1 / PSL. Source-method improvements from 2016 are retained in the record.

Use the year and month controls to highlight a reading. Two source cells have no values throughout the subset; their empty records remain in the full grid download.

KEEP THE DEFAULT REFERENCE FIGURE

A complete scientific
reading to share.

Thirty-five years of sea-temperature monthly estimates at the offshore reference cell, with seasonal curves and full history
This fixed figure uses the default offshore cell and includes the 2025 curve. Interactive cell choices above do not change this publication figure.

Data, checks, source resolution and dates

NOAA OISST combines bias-adjusted satellite, ship, buoy and Argo observations with interpolation on a quarter-degree global grid. Resolution does not establish accuracy at a particular beach. This reader uses NOAA PSL’s monthly-mean product, January 1991–December 2025. Same-calendar-month means give each year equal weight. Lowest and highest values are across monthly means, not daily extremes.

The returned source subset has 420 dates and 20 native cells. All axes and calendar dates were checked. 7,560 values are finite estimates; 840 are the source missing value in two cells, retained as empty entries. No missing temperature was filled here. January 2025 at the default cell was independently recomputed from 31 NCEI daily records; the mean agrees with the PSL monthly value within 0.00001°C. This checks one aggregation using the upstream archive, not an independent local thermometer or every grid value.

Version 2.1 retained the pre-2016 SST data from version 2 and improved inputs and bias corrections from 2016. The dataset’s method history matters when comparing periods. No future sea temperature, home comfort, rental performance, current wave or current conditions, swimming access or beach safety is derived from these historical temperatures.

Data: Huang and colleagues (2020), NOAA OISST v2.1, DOI 10.25921/RE9P-PT57; monthly data provided by NOAA PSL, Boulder, Colorado, USA; accessed 14 October 2026. Coast geometry: © OpenStreetMap contributors, ODbL. Cape reference: GeoNames, CC BY 4.0. Existing source geometry and cape point are unchanged.

NOAA product and method · Monthly source subset · Daily January cross-check.